
Do mortgage interest rates respond more strongly to the rise of interest rate than the falls of interest rate?
Do mortgage interest rates respond more strongly to the rise of interest rate than the falls of interest rate?
1. Introduction
On November 15, a number of mortgage providers raised their interest rates in response to Donald Trump's presidential election (NOS, 2016).
The underlying reason seems to be that Trump wants to borrow large amounts of money, causing the price of those loans (the interest on government loans) to rise. The higher interest rates result in higher costs for banks, which they pass on to a higher mortgage interest rate.
The question then is how strongly mortgage rates respond to changes in interest rates on government bonds and whether interest rate reductions are passed on as quickly as interest rate increases?
This article attempts to provide an indication of this assumption based on monthly data from the ECB on mortgage and government bond yields.
This article shows that positive interest rate changes are passed on faster than negative changes, particularly in the Netherlands, Italy and Portugal. These findings may indicate limited competition in these markets.
2. Price increases and price drops
One of the ways in which the economic literature examines whether there is less competition, by testing whether prices are just as strong respond to cost increases as cost decreases1.
1 Other methods are also used, such as the mean-variance test, see the mean-variance study about which SOMI published last November 11, 2016 at www.kenniscentrumvastgoedfinancieren.nl
The idea behind this is that profit margins are low in a competitive market. This means that an increase in costs must be reported immediately, otherwise, loss will be incurred.
And in a competitive market, cost decreases are also immediately passed on. If this does not happen, a competitor sets a lower price and thereby attracts all customers.
In a non-competitive market, cost increases are also immediately passed on, but cost decreases are not. Because providers know that they are not immediately priced out of the market by a competitor, they can keep their prices at a higher level. The empirical literature provides evidence that prices generally respond more strongly to cost increases than to cost decreases.
For example, Borenstein, Cameron and Gilbert (1997) show this phenomenon for the petrol market, and Peltzman (2000) shows that this applies to a large number of products.
This has also been investigated for the Dutch mortgage market, namely by De Haan and Sterken (2011) and Toolsema and Jacobs (2007). Toolsema and Jacobs (2007) use monthly data between 1978 and 2000 to show that mortgage interest rates respond more strongly to price increases than to price decreases, while De Haan and Sterken (2011) use daily data between 1997 and 2003 to show a correlation of stronger response to cost decreases than to cost increases. In this publication, an estimate is made for the period 2003-2016 using the same method.
3. Method
De Haan and Sterken (2011) and Toolsema and Jacobs (2007) both use the so-called error correction model for the effect of increases and decreases in costs estimate2.
2 An error-correction model is usually used when there is cointegration: there is a long-term equilibrium between two variables, but in the short term these variables mainly depend on their own past.
An error correction model boils down to estimating two relationships: a long-term equilibrium relationship and a short-term relationship in which the long-term equilibrium can be deviated from. The long-term balance is first estimated using the following formula:
Formula (1)ÃÂàÃÂàÃÂàÃÂàÃÂàrmort,i,tÃÂà=ÃÂàÃÂò0ÃÂà+ ÃÂò1rf,i,tÃÂà+ RESt
In formula (1),ÃÂÃÂ rmort,i,tÃÂÃÂ is the mortgage interest in the country i in month t, andÃÂÃÂ rf,tÃÂÃÂ is the interest on government bonds in the country i in month t.
The two are expected to be positively related: a higher interest rate on government bonds means that borrowing money is more expensive, so mortgage interest rates will also be higher.
The residue of this long-term relationship is then included in the short-term relationship. The residue of the long-term relationship must be included here as interest tends to return to equilibrium.
For example, if there is a higher mortgage interest rate than the one in the balance, it is expected that the mortgage interest rate will be adjusted down anyway:
Formular (2)ÃÂàÃÂàÃÂàÃÂàÃÂÃÂrmort,i,tÃÂà=ÃÂàÃÂû+ÃÂÃÂr+f,t-1ÃÂà+ÃÂàÃÂàÃÂû-ÃÂÃÂr-f,t-1ÃÂà+ÃÂàÃÂàÃÂÃÂ+RES+t-1ÃÂà+ÃÂàÃÂÃÂ-RES-t-1ÃÂà+ÃÂàÃÂõt
Therefore, if mortgage interest rates tend to fall below its equilibrium value and upwards if it is below equilibrium value, it is expected that ÃÂÃÂ^+ and ÃÂÃÂ^- will both be negative. This means that when the mortgage interest is above the equilibrium value (REStÃÂÃÂ is positive), the mortgage interest tends to fall in the next period and vice versa if the mortgage interest is below the equilibrium value (REStÃÂÃÂ is negative).
Note thatÃÂÃÂ REStÃÂÃÂ here is divided intoÃÂÃÂ RESt+ÃÂÃÂ andÃÂÃÂ RESt-ÃÂÃÂ for the positive and negative values ofÃÂÃÂ RESt.This operation was performed because there may be a difference between an adjustment to the equilibrium when the mortgage interest is above its equilibrium value and when it is below its equilibrium value.
The other variables in formula (2) are the changes in the values from formula (1): ÃÂÃÂrmort,i,tÃÂàis the change in mortgage interest per month (ÃÂÃÂrmort,i,tÃÂà=ÃÂàrmort,i,tÃÂàâÃÂÃÂÃÂàrmort,i,t-1ÃÂà)ÃÂàwhileÃÂàÃÂÃÂr+f,t-1ÃÂàandÃÂàÃÂÃÂr-f,t-1ÃÂàseriesÃÂàreflects the positive and negative changes in government bond yields, respectively.
To find out whether the mortgage interest rate responds as strongly to interest rate rises as the interest rate falls, it is tested whether the coefficients at ÃÂÃÂr+f,t-1ÃÂàand ÃÂÃÂr-f,t-1ÃÂàare equal in size, so it must be investigated whether ðÃÂÃÂÃÂ+ÃÂà= ðÃÂÃÂÃÂ-.
4. Data
The data source for mortgage and ten-year government bond yields is the ECB's Statistical Data Warehouse. For this investigation, the weighted average of all mortgages and the long-term interest rate as collected by the ECB were used to measure convergence between countries. This is a ten-year interest on government bonds. The ECB collects this data on a monthly basis.
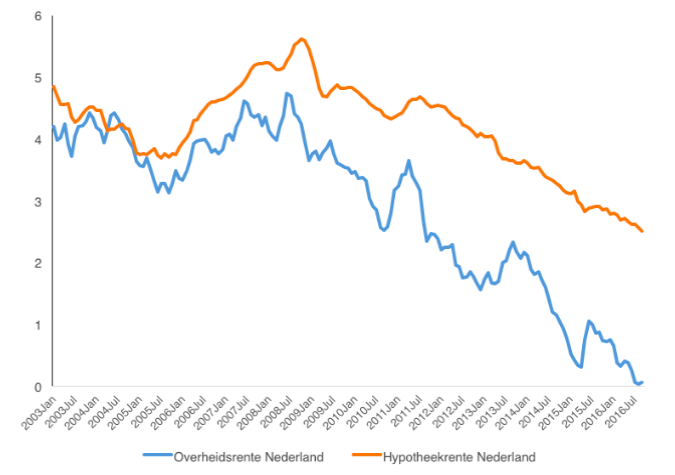
Figure 1: Government interest (blue) and mortgage interest (orange) in the Netherlands in percentages.
Source: ECB Statistical Data Warehouse
Figure 1 shows what the series looks like for the Netherlands. It can be seen that the two series remain fairly close until about the start of the financial crisis, after which mortgage rates remain at a permanently higher level.
5. Results
Although De Haan and Sterken (2011) and Toolsema and Jacobs (2007) both use a cointegrating model, no cointegration is observed for this dataset (see appendix A for the test results).
This means that there is no long-term relationship between the two variables and in this case, only the short-term relationship - equation (2) - estimated should be3.
For robustness, the relationship is again estimated below with the long-term relationship. This leads to comparable results.
The results for the Netherlands are shown in table 1. The first column shows that the coefficient on the positive changes is greater than on the negative changes in government interest rates and that both increases and decreases have a significant effect on mortgage rates.
Columns 2 and 3 divide the data set in the period before and after the crisis. It is striking that before the crisis, the interest rate falls had a significant effect on mortgage interest rates, but interest rate rises did not, and interest rate rises after the crisis had a significant effect, while interest rate falls did not significantly affect mortgage interest rates.
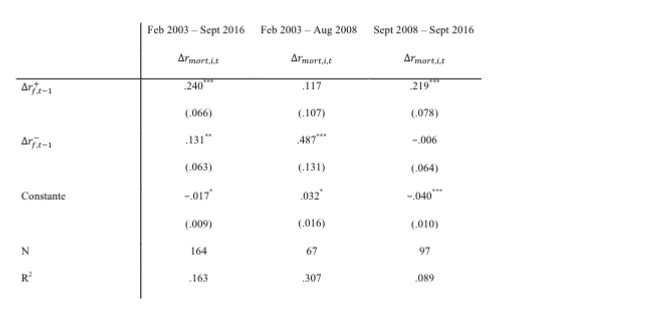
Table 1:ÃÂÃÂ Effect of changes in government bond yields on mortgage rates for the Netherlands (standard errors are in brackets)
*, **, ***: Significant at the 10%, 5% and 1% level, respectively
Table 2 provides an international comparison of the coefficient on positive and negative changes in government rates of countries from the beginning, which are part of the Eurozone4.
No data was available for Luxembourg.
The first two columns show the coefficients on interest rate rises and interest rate decreases respectively, while the third column shows the p-values of a Wald test comparing whether the two coefficients are equal to each other.
It can be seen that the coefficient on interest rate rises for the Netherlands is 0.240, while the coefficient on interest rate falls is 0.131, but this difference is not significant. This has to do with the standard errors of the estimates, put together and it is probably, too big to speak of a significant difference. This is partly due to the raw level of data collected by the ECB on a monthly basis.
It is striking that only a significant difference is found for Italy, while it is precisely in this country that the competition authority has actually established price agreements (Italian Competition Authority, 2016).
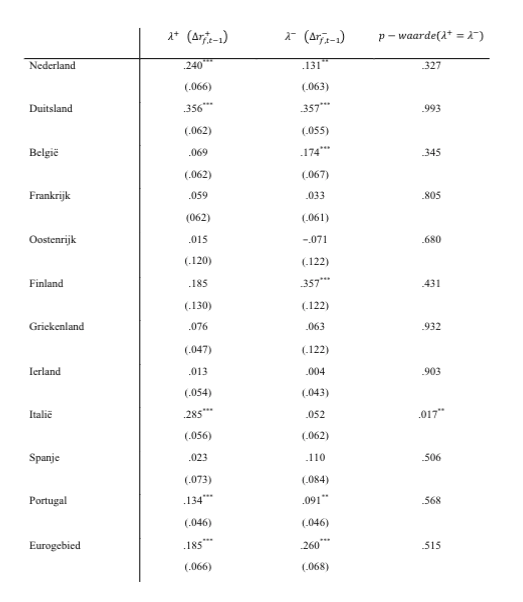
Table 2: Effect of changes in government bond yields on changes in mortgage interest rates in the Netherlands, Germany, Belgium, France, Austria, Finland, Greece, Ireland, Italy, Spain, Portugal and Eurozone (standard errors in brackets, constant estimate, February 2003-September 2016).
*, **, ***: Significant at the 10%, 5% and 1% level, respectively
In table 3 the results are estimated again, but now only for the period after the fall of Lehman Brothers, ie from September 2008.
Now a significant difference (at 10% level) for the Netherlands can be seen between the response to interest rate rises and the interest rate falls. This also applies to Italy (where price agreements have been established) and to Portugal, where the competition authority has officially called banks to account for anti-competitive behavior (Portuguese Competition Authority, 2015).
It is also striking that in Finland and Belgium only the negative changes in government interest have a significant impact on mortgage interest, while the positive changes have no significant effect. This seems to indicate that there is a competitive market in these countries.
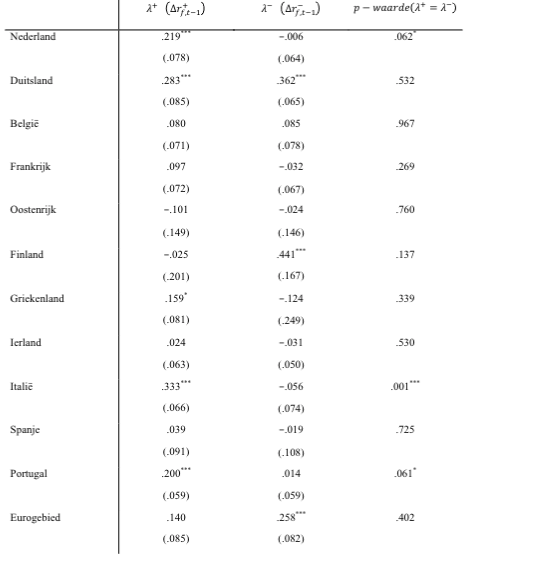
Table 3: Effect of changes in government bond yields on changes in mortgage rates in the Netherlands, Germany, Belgium, France, Austria, Finland, Greece, Ireland, Italy, Spain, Portugal and Eurozone (standard errors in brackets, constant estimate, September 2008 - September 2016).
*, **, ***: Significant at the 10%, 5% and 1% level, respectively
6. Robustness: cointegration and more delay terms
For robustness, the analysis was again performed with two different specifications.
Initially, the cointegration test indicated that there was no cointegration (appendix A), but this can never be completely ruled out, and earlier studies by De Haan and Sterken (2011) and Toolsema and Jacobs (2007) found the cointegration.
As a result, the relationship is again estimated in the form of an error correction model, so that formulas (1) and (2) are both estimated instead of just formula (2). The results are shown in Table 4. In this case, only the dataset between September 2008 and September 2016 is estimated, because it is one more above that showed significant results.
5 the analysis with all data between 2003 and 2016 gave similar results as above: a higher coefficient for the interest rate increases than the interest rate decreases, but this difference was not significant.
The result is comparable to the above results so that mortgage interest reacts more strongly to interest rate rises than to interest rate falls. And as above, this result applies to the Netherlands, Italy and Portugal.
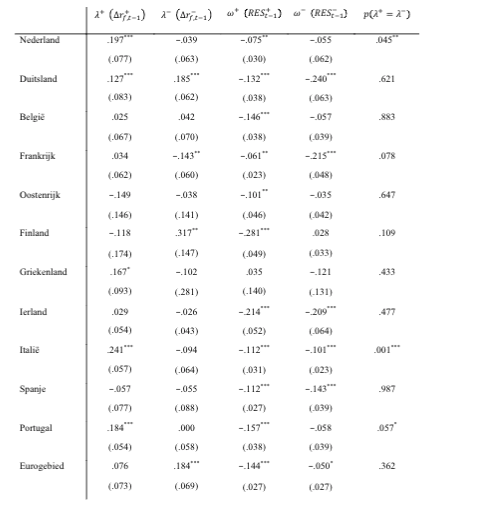
Table 4: Effect of changes in government bond yields on changes in mortgage interest rates in the Netherlands, Germany, Belgium, France, Austria, Finland, Greece, Ireland, Italy, Spain, Portugal and Eurozone (standard errors in brackets, constant estimate, September 2008 - September 2016).
*, **, ***: Significant at the 10%, 5% and 1% level, respectively
In addition, a robustness test was carried out by including an additional delay term ('lag') in the analysis. Therefore, the equation estimated becomes the following:
Formula (3)ÃÂàÃÂàÃÂàÃÂÃÂrmort,i,tÃÂà= ÃÂû+1ÃÂÃÂr+f,t-1ÃÂà+ÃÂàÃÂû-1ÃÂÃÂr-f,t-1ÃÂà+ÃÂàÃÂû+2ÃÂÃÂr+f,t-2ÃÂà+ÃÂàÃÂû-2ÃÂÃÂr-f,t-2ÃÂà+ÃÂàÃÂõt
Note that in this comparison no cointegration is included again because cointegration could not be determined (appendix A).
Table 5 shows the results. It is striking for the Netherlands that only the coefficient on the first delayed interest rate rise is significant, while the second delayed interest rate rise and both interest rate delayed terms differ insignificantly from zero.
Taken together, however, the interest rate rises do not differ significantly from the interest rate falls. This still applies to Italy and Portugal.
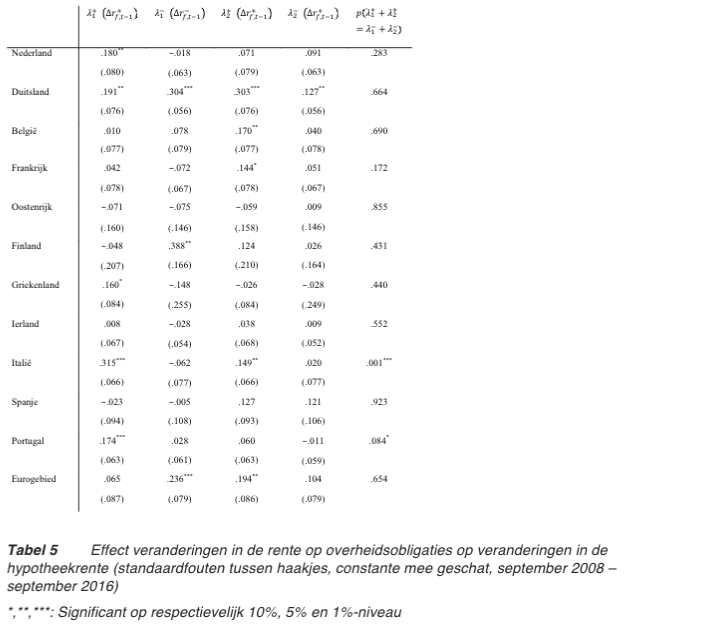
Table 5: Effect of changes in government bond yields on changes in mortgage rates in the Netherlands, Germany, Belgium, France, Austria, Finland, Greece, Ireland, Italy, Spain, Portugal and Eurozone (standard errors in brackets, constant estimate, September 2008 - September 2016).
*, **, ***: Significant at the 10%, 5% and 1% level, respectively
7. Conclusion
Based on a dataset of monthly observations, it appears that after the financial crisis, Dutch mortgage interest rates respond more strongly to interest rate rises than to interest rate falls.
This applies to the Netherlands, Italy and Portugal, where price agreements have been established in Italy (Italian Competition Authority, 2016), and banks in Portugal have been officially held accountable by the competition authority for anti-competitive behavior (Portuguese Competition Authority, 2015).
Although the data is rough, the results indicate that there is less competition in the Dutch mortgage market.
8. References
Borenstein, S., A.C. Cameron, en R. Gilbert (1997) Do gasoline prices respond asymmetrically to crude oil price changes? Quarterly Journal of Economics, Vol. 112, p. 305-339
Haan, L. de, en E. Sterken (2011) Bank-specific daily interest rate adjustment in the Dutch mortgage market, Journal of Financial Services Research, Vol. 39(3), p. 145-159
Italian Competition Authority (2016) Mortgage interest rate collusion in the provinces of Trento and Bolzano: the ICA imposed a 27 million euro fine on banks and cooperatives, Persbericht, no. I777
NOS (2016) Aantal hypotheekverstrekkers verhoogt rente na Trump, NOS, 16 november 2016
Peltzman, S. (2000) Prices rise faster than they fall, Journal of Political Economy, Vol. 108(3), p. 466-502
Portuguese Competition Authority (2015) Portuguese Competition Authority sends a statement of objections to 15 banks regarding an alleged anticompetitive practice, Persbericht, no. 11/2015
Toolsema, L.A., en J.P.A.M. Jacobs (2007) Why do prices rise faster than they fall? With an application to mortgage rates, managerial and decision economics. Vol. 28(7), p. 701-712
Appendix A Cointegration
This appendix shows the Engle-Granger test values for cointegration, where the null hypothesis is that there is no cointegration. The tau statistic and p-values are shown in table A1 and show that none of the series seem to show cointegration.

Table A1: Tau statistics and p-values Engle-Granger test for cointegration (no trend or constant, layers based on Schwartz Information Criterion).