
Test European Mortgage Interest Rates
This document performs the mean-variance test for the mortgage interest in the Netherlands and other European countries.
1. Introduction
In this test, the mean and standard deviation of the price of a good compared to give an indication of whether there may be price agreements. Out of all our samples, the Netherlands is the only country after the financial crisis in which both a higher mortgage interest rate and a lower standard deviation of the knows mortgage interest was observed.
In a comparison with the interest of 10-years government bonds, this appears to be the case alone. The following applies to mortgage interest: the Netherlands 10-years government interest falls right to the middle.
The findings in this document suggest that this has been the case of reduced competition on the Dutch mortgage market.
Several parties have argued in recent years that there is insufficient competition took place in the Dutch mortgage market (ACM, 2013; 2014; Wijffels Committee, 2013; CPB, 2013; Dijkstra and Schinkel, 2014; DNB, 2015). And from an international perspective, Dutch mortgage interest rates are therefore higher in the period after the financial crisis (figure 1).
This research takes a closer look at the competition in the mortgage market by one so-called mean-variance test for the Netherlands and other European countries.
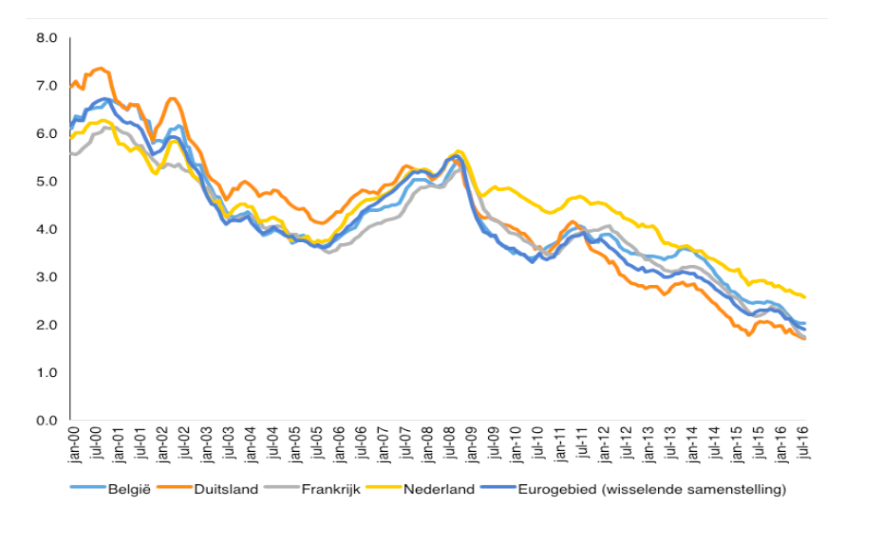
Figure 1: Comparison of mortgage interest in Belgium, Germany, France, Netherlands, European Economics Area (varying compositions). Total of all maturities in percentages.
Source: ECB Statistical Data Warehouse
2. Mean-variance test
The mean-variance test is described by Abrantes-Metz et al. (2006) as a statistical test with which an initial indication can be made whether there are price agreements on a market.
It works intuitively as follows: in the case of price agreements, prices become artificially set and held high. Because of this, it is expected that the price is on average higher in price agreements than if there were no price agreements. This is the mean (average) part of the test: the average price is higher in the case of price agreements.
In addition, it is expected that prices will fluctuate in a small amount if there are price agreements so that a lower fluctuation rate of the price is expected. The fluctuation of the price can be measured by the standard deviation, which gives a value for the spread of the price. This is the variance part of the test: the standard deviation of the price is lower in the case of price agreements.1
Although Abrantes-Metz et al. (2006) use standard deviations to calculate fluctuations in the price, in practice, it is usually referred to as the mean-variance test.
By dividing the average price by the standard deviation of the price, a situation with price agreements can be compared to a situation without price agreements.
In general, the mean-variance value (mean divided by standard deviation) in a situation with price agreements will be higher. Notice hereby note that the results of this test cannot conclusively establish whether there are price agreements, but they can provide an initial indication that there is something wrong with competition in a market.
3. Method and data source
In order to perform the mean-variance test, average mortgage interest rates and the standard deviation of the mortgage interest is calculated. For this research, we are working with the mortgage interest rate with a fixed interest period of more than 10 years, comparing the situation before and after the crisis. The starting point of the crisis was in September 2008 when Lehman Brothers fell over.
The data source is from the Statistical Data Warehouse of the ECB which is series of monthly data of mortgage interest rates in the Netherlands and other European countries.2The series for the mortgage interest with a fixed-rate period of longer than 10 years starts in January 2003, so there are a total of 68 monthly data before the start of the crisis.
The official term used by the ECB is the interest rate on "lending for house purchase".
To compare the standard deviation before and after the crisis, we used as many data from September 2008, so that it also runs for 68 months: from September 2008 to April 2014. The periods to be compared are from January 2003 - August 2008 and September 2008 - April 2014.
4. Results
The first indication about the development of the mortgage interest with a fixed-rate period longer than 10 years can be seen in figure 2. The graph here shown some indication of a higher level and lower fluctuation of Dutch mortgage interest rates than in neighboring countries.
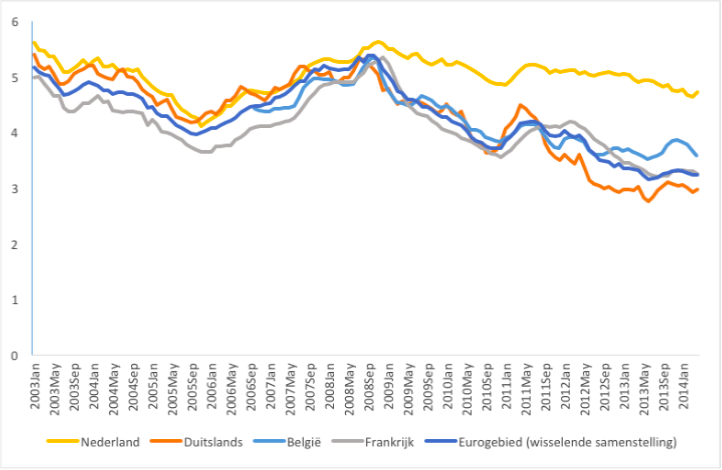
Figure 2: Mortgage interest with a fixed-rate period longer than 10 years in the Netherlands, Germany, Belgium, France, European Economics Area (percentages).
Source: ECB Statistical Data Warehouse
Table 1 shows the average mortgage interest rate for the Netherlands and the standard deviation of the mortgage interest with a fixed interest period longer than 10 years. It can be seen that the average remains approximately the same, but the standard deviation decreases by about forty percent from 0.38 to 0.23. It was observed that a sharp decrease in the standard deviation also increases the mean-variance value from 13.04 to 22.38.
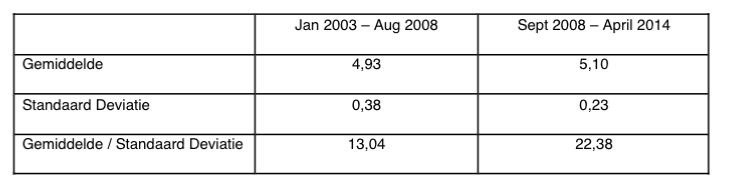
Table 1: Average, Standard Deviation and Average/Standard Deviation of the Dutch mortgage interest rate with a fixed-rate period longer than 10 years.
Source: ECB Statistical Data Warehouse
Table 2 shows the results of Table 1 from an international perspective by including the average and standard deviation of the other countries that are part of the euro area. The table always shows the average and standard deviation compared, with a higher value in bold.
3 Due to missing data, Greece, Luxembourg and Portugal are not included.
It can be seen that the Netherlands, together with Spain, is the only one with an average higher mortgage interest rates after the financial crisis, and together with Finland and France, a lower standard deviation.
This means that no country except the Netherlands has a higher average as a lower standard deviation.
When average and standard deviation are combined into a mean-variance value, this is higher for the Netherlands, Italy and Spain in the period after the crisis compared to the period before the crisis, but what the values for Italy and Spain are roughly equal to pre-crisis values, almost doubling for the Netherlands.
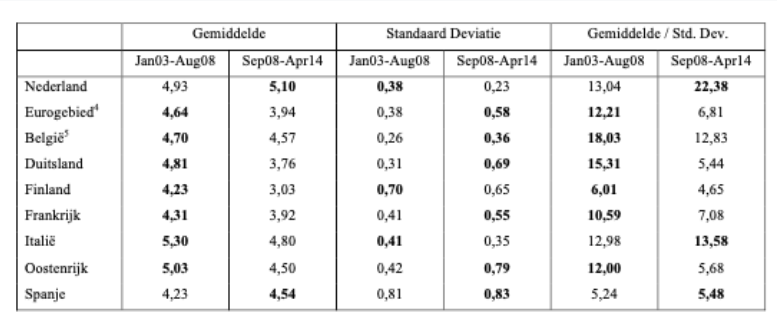
Table 2: Comparison of the Netherlands, European Economics areas, Belgium, Germany, Finland, France, Italy, Austria and Spain of the Average, Standard Deviation, Average/Standard Deviation of the mortgage interest rate with a fixed-rate period longer than 10 years.
Source: ECB Statistical Warehouse
Varying compositions
The data series for Belgium will only start from October 2006, so that for Belgium the period October 2006 - August 2008 is compared with September 2008 - July 2010.
5. Comparison with long-term interest
In this section, the results for the mortgage interest are compared with the long-term interest rates as collected by the ECB for convergence measures between countries. This is a ten-year interest on government bonds.
For the same period (January 2003 - April 2014), Figure 3 shows the progress of the interest for the Netherlands and neighboring countries.
It is striking here that the Netherlands is not exceptional internationally in the course of the 10-year interest on government bonds.
Where Dutch mortgage interest rates remained permanently at a high level, there is a decline of the 10-year government interest rate with the interest rates of neighboring countries and which remains in the middle. The European average is much higher here and this is in particular as a result of the euro crisis in which the interest rates of Southern European governments rose significantly higher.
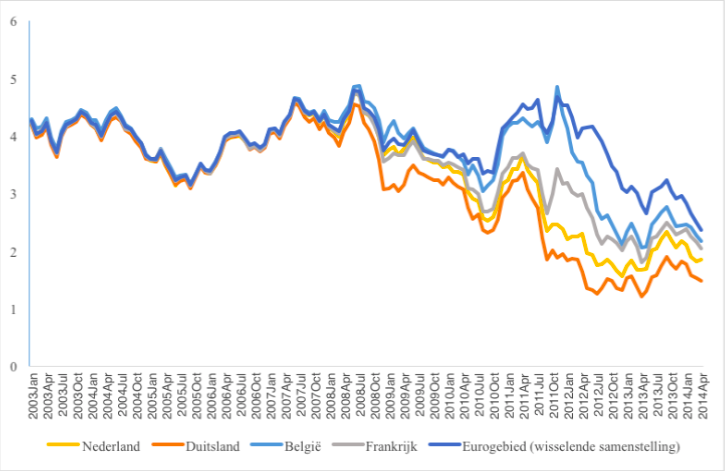
Figure 3: Interest on government bonds in the Netherlands, Germany Belgium, France, European Economic Areas, with a term of 10 years (percentages).
Source: ECB Statistical Data Warehouse
Table 3 shows the mean-variance test, but for the government interest instead of mortgage interest. Here, it can be seen that the interest in southern European countries has risen sharply but in the northern European countries, including the Netherlands, has fallen. The standard deviation goes up for all countries, and mean-variance statistics are decreasing for all countries.
The Netherlands, therefore, does not have the same exceptional position for government interest rates for the mortgage interest.
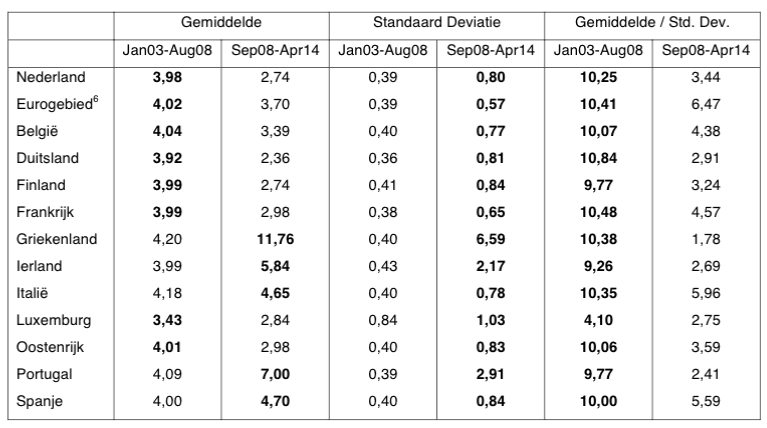
Table 3: Comparison of the Netherlands, European Economic Areas, Belgium, Germany, Finland, Greece, Ireland, Italy, Luxemburg, Austria, Portugal and Spain on the Average, Standard Deviation and Average/Standard Deviation of the interest rate on government bonds with a fixed interest rate period of 10 years.
Source: ECB Statistical Data Warehouse
Varying compositions
6. Conclusion
A mean-variance test for the Dutch mortgage market shows that the Dutch mortgage interest rates are higher in the period after the crisis than the period before that, while the standard deviation of the mortgage interest has decreased. This is in contrast to other European countries, which generally had a lower mortgage interest rate and a higher standard deviation.
Of the countries studied, the Netherlands is the only country that has higher average mortgage interest rates in combination with a lower standard deviation of that interest.
This only applies to the Dutch mortgage interest: when the 10-year interest compared to government bonds, the mean-variance value has decreased, just like the other European countries.
Although the mean-variance test is inconclusive about the existence of the price agreements, the test suggests that on the Dutch mortgage market there has been less competition.
7. References
Abrantes-Metz, A.M., L.M. Froeb, J.F. Geweke, en C.T. Taylor (2006) A variance screen for collusion, International Journal of Industrial Organization, Vol. 24, p. 467-486
ACM (2013) Concurrentie op de hypotheekmarkt: Een update van de margeontwikkelingen sinds begin 2011, Den Haag: Autoriteit Consument en Markt
ACM (2014) Barriëres voor toetreding tot de Nederlandse bancaire retailsector, Den Haag: Autoriteit Consument en Markt
Commissie Wijffels (2013) Naar een dienstbaar en stabiel bankwezen, Den Haag: Commissie Structuur Nederlandse Banken
CPB (2013) The Dutch housing market -mortgage interest rates, house prices and consumption, CPB Communication, February 14
Dijkstra, M.A., F. Randag, en M.P. Schinkel (2014) High mortgage rates in the Low Countries: what happened in the spring of 2009? Journal of Competition Law and Economics, Vol. 10(4), p. 843 - 859
DNB (2015) Visie op de structuur van de Nederlandse bankensector, Amsterdam: De Nederlandsche Bank