
Literature Dutch Mortgage Market
Literature Dutch Mortgage Market
The Dutch mortgage interest rate has been significantly higher than the mortgage interest rate in neighboring countries since 2009. Most of the studies investigating Dutch mortgage interest rates attribute the high interest rate to less competition. The main explanations seem to lie in price leadership bans imposed by the European Commission and a lack of market entry, which describes the literature on the Dutch mortgage market and compares the findings with research into the Dutch mortgage market before the financial crisis.
- 1. Introduction
Since the financial crisis, Dutch mortgage interest rates have been much higher than the interest rates in countries around us (figure 1).
Several researchers have already written about possible explanations. This article provides an overview of the studies that have been published on the Dutch mortgage market.
Even when the mortgage interest is compared to the Dutch interest on consumer credit, there is a remarkable pattern in which the mortgage interest and the interest on consumer credit are approximately the same until the crisis, while the mortgage interest thereafter is at a permanently higher level until about mid-2015.
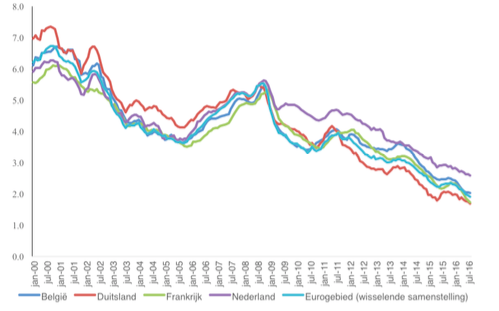
Figure 1: Comparison of mortgage interest rates between Belgium, Germany, France, the Netherlands and Eurozone. Mortgage interest on new contracts as a percentage (Source: ECB).

Figure 2:ÃÂÃÂ Mortgage interest and interest on consumer credit. Interest in percentages on new contracts (Source: DNB)
The basis of the discussion about high mortgage interest rates lies in the report of the NMa (2011), which carries out a deeper investigation into the Dutch mortgage market after its quick inspection (NMa, 2010).
The basis of both the inspection and the sector study is a calculation of the profit margin on average mortgages. This showed that interest marginsÃÂÃÂ were historically high between 2009 and 2011. In the inspection (NMa, 2010), the NMa does not yet make any statements about why the margins are so high, while it indicates in the sector study (NMa, 2011) that although the market is sensitive to price matching, there are no indications that prices are actually being aligned and margins will be back to their pre-crisis level by the end of 2011.
Dijkstra and Schinkel (2012) extend the series of NMa (2011) to 2012 with a few minor adjustments1, and note that margins increased again after the end of 2011.
1 While NMa (2011) charges fixed costs of 0.8 percentage points on mortgage interest, Dijkstra and Schinkel (2012) calculate the difference in margin between pre- and post-crisis.
After this, ACM2 (2013) extends the study by NMa (2011) and also includes the costs of Basel 3 by focusing on the amount of equity capital of banks. In this study, margins also appear to be high after the crisis, which ACM (2013) explains in particular due to a lack of competition due to capacity restrictions: because banks had difficulty raising enough money, they had to charge high prices.
2 In 2013, the Consumer Authority, OPTA and the Netherlands Competition Authority merged to form the Netherlands Authority for Consumers and Markets (ACM).
This conclusion came by after 2009 when there is a strong correlation between concentration and margins, which is also the case in an oligopolistic market with capacity constraints. In addition, ACM (2013) points to reduced entry compared to the pre-financial crisis period.
Overvest and Tezel (2014) explain the methodology of the calculations and indicate that price leadership bans may give rise to the high margins, while they are not direct indications for (tacit) price agreements. None of the NMa / ACM's investigations indicate explicit price agreements, although each of the investigations finds that there is something wrong with competition on the Dutch mortgage market.
- 2. Cost statements
In all studies discussed here, cost statements virtually indicate cost increases, whether or not in addition to reduced competition. These cost statements can be divided into several statements, namely statements based on expensive deposits, highÃÂÃÂ perceived risk on Dutch banks and regulatory costs, in particular Basel 3.
Deposit funding gap
Deposit rates are relatively high in the Netherlands, which is a partial explanation for the high Dutch mortgage rates. Bovenberg and Polman (2013) point to the so-called deposit financing gap: the difference between the outstanding deposits of Dutch banks and the debts of Dutch households. Due to this widening deposit financing gap, Dutch banks are less able to finance cheap deposits compared to foreign banks, which means they have higher financing costs.
However, Dijkstra and Schinkel (2012, 2014) show that the deposit financing gap does not suddenly leap, but rises gradually, while mortgage interest rates jump abroad. In addition, a comparison with German deposit and mortgage interest rates shows that the difference between mortgage and deposit rates in the Netherlands before the crisis is lower, while the difference is higher after the crisis.
Risky banks
Risky banks associated with the deposit financing gap are perceived risks from Dutch banks. Dutch banks are seen as relatively risky, partly due to high loan-to-values, which in turn leads to higher financing costs. However, the question is whether Dutch banks are really that risky. In a comparison of CDS spreads between Dutch and German banks, Dijkstra and Schinkel (2012, 2014) conclude that the high CDS spreads mainly apply to smaller mortgage providers, while the big three mortgage providers (Rabobank, ING and ABN AMRO) have a lower risk. Mortgage providers in the Netherlands have also received capital injections from the Dutch government, which partly removes the risk for creditors. Despite the high debts, the Dutch also have hardly any defaulters, andÃÂÃÂ the largest risk groups are often covered by the NHG. A report by DNB (2016) therefore shows that Dutch banks hardly had to write off their mortgage portfolios.
Basel 3Another argument mentioned is the cost of complying with Basel 3 legislation. This is again related to the high loan to values of Dutch mortgages. Because those loan to values was so high, the risk weights are also relatively high, which means that banks with larger equity capital have to finance.
However, the question is how strong the impact of Basel 3 is. Several academics such as Admati et al. (2013) indicate that more equity financing also automatically reduces the cost of this equity, via the classic Modigliani and Miller (1958) argument: because greater equity bears the risk of the bank unit risk is lower, which is more nuanced for banks, as banks benefit from various benefits of borrowed money, such as tax-deductibility of interest payments, the deposit guarantee scheme and implicit too big to fail subsidies.
However, these benefits are in part improper, with the only risk being passed on to governments, so that potentially high cost of equity better reflects the actual cost of capital (Admati et al, 2013), but even when the costs of Basel 3 are added in calculations by ACM (2013) and Dijkstra and Schinkel (2013), the entire margin that banks earn on mortgages is not yet explained.
- 3.ÃÂÃÂ Competition Statements
In addition to the cost increases mentioned above, the majority of the investigations into the Dutch mortgage market indicate that there has been less competition since 2009.
Concentration
The Dutch mortgage market has become highly concentrated in the period under investigation and has only become more concentrated over time. For example, NMa (2011) observes that Rabobank, ABN AMROÃÂÃÂ and ING jointly controlled more than 70 percent of the mortgage market in 2010.
A high concentration may indicate low competition and may therefore explain the high Dutch mortgage interest rates. However, it is not immediately clear whether a high concentration really means less competition, see for example Spierdijk (2012).
More important seems the possibility of entry. In addition, the concentration rate of the Dutch mortgage market will not jump in 2009, but will rise in a steady jump, so that the concentration rate does not seem to fully explain the sudden jump in Dutch mortgage interest rates.
Price leadership bans
The European Commission markedly limited competition in the Dutch mortgage market after the crisis. During the fall of 2008, three of the four largest mortgage lenders in the Netherlands, ING, ABN AMRO and AEGON, received state aid because they would fall over otherwise. Only the largest Dutch mortgage provider, Rabobank, did not require state aid.
State aid is prohibited under Article 108 TFEU. The European Commission authorized the resources during the crisis as temporary emergency measures. In 2009, the European Commission formulated conditions for the banks that had received aid so that they would benefit as little as possible from parties that had not received any state aid.
One of those conditions was a so-called price leadership alliance, which aimed to prevent a bank that had received state aid from misusing state aid by applying a low price. The price leadership bans stipulate that the bank in question could not offer more favorable rates than comparable competitors on certain standardized products.
In the Netherlands, a price list ban was imposed on ING, ABN AMRO and AEGON. In theÃÂÃÂ mortgage market, these providers were no longer allowed to offer a lower rate than that of their three best-priced direct competitors. In the highly concentrated Dutch mortgage market, the price leadership bans effectively appointed Rabobank as a price lister.
If Rabobank raised its mortgage interest rates, its competitors would have to follow whether their prices would violate state aid conditions.
Rabobank's best response was therefore to raise its rates and thus the market price level, above which no further coordination was required, and the timing of the price leadership bans is interesting.
The Dutch mortgage interest pattern broke as early as May 2009, while the bans were not legally imposed until late 2009 and early 2010. NMa (2011) and ACM (2013) therefore reject the prohibitions as an explanation out of hand, although this may have been anticipated.
Banks could see price leadership bans coming in light of previous state aid decisions by the European Commission. The Commission has already indicated in its first communication in 2008, as well as in the provisional approvals, that it considered such behavioral restrictions to be necessary. In addition, there were months of state aid negotiations between the Dutch government and the European Commission.
Dijkstra, Randag and Schinkel (2014) indicate that Rabobank specifically asked the European Commission to impose a price leadership ban on its rivals. At least on April 24, 2009, European Commissioner Kroes made it absolutely clear during conversations with ING in Brussels that ING, in her opinion, should be prepared to accept a price leadership ban, and soon after, on May 7, the European Commission sets a precedent byÃÂÃÂ imposing a price leadership ban to Commerzbank in Germany.ÃÂÃÂ
This is the month in which Dutch mortgage interest rates rise sharply, contrary to the European trend. NMa / ACM's rejection of price leadership bans as an explanation for the high Dutch mortgage interest rates is all the more remarkable in the information that has come to light later.
In the summer of 2012, investigative journalists from ZEMBLA discovered that NMa, like Pieter Kalbfleisch personally, warned the European Commission in October 2009 that price leadership bans for ING and possibly also for ABN Amro would lock the Dutch mortgage market. European Commissioner Kroes did not respond materially to NMa's warning. Commissioner Kroes later said it was too late in negotiations to change price leadership bans.
Investigators from the NMa's Economic Bureau (Mulder and Lengton, 2011) also found that price leadership from banks that received state aid had a significant negative effect on mortgage interest rates, suggesting that price leadership bans would therefore increase prices.
Mulder (2014) refines the results and, depending on the specification, produces comparable results. Dijkstra (2017) directly investigates the effect of price leadership bans by examining how banks respond to each other before and after the financial crisis using a dataset of NHG mortgages in the period 2004-2012. He notes that banks after the financial crisis
respond much more strongly to the price-leading bank, which isÃÂÃÂ consistent with how banks react in a market with price leadership bans.
Capacity restrictions
ACM (2013) explains the high margins based on a theory of an oligopoly model with capacity restrictions. Banks may have had insufficient access to finance, forcing them to charge higher prices. This is in line with VanÃÂÃÂ de Minne and Teppa (2015) and Francke, Van de Minne and Verbruggen (2016), who indicate that credit conditions have deteriorated after the financial crisis and that these credit conditions are an important explanation for the high mortgage interest rates.
These studies do not explicitly examine competition in the mortgage market. In addition, it is not clear whether banks really had insufficient access to financing. Banks made a profit and paid dividends to shareholders, which could also have been used to provide credit. If there had really been a lack of credit, banks would have been less likely to have distributed available profits to shareholders.
Entry barriers
ACM (2014) published a report on barriers to entry in the Dutch banking market based on research by KPMG (2014) that interviewed foreign parties about not being able to enter the Dutch market. For the mortgage market, this revealed that foreign parties do not enter the Dutch market due to high perceived risk, uncertainty about future policy and DNB's difficulties; perceived risks are related to high loan to values, and uncertainty about future policy has to do with a possible limitation or abolition of the mortgage deduction, which could have strong effects on the mortgage market.
It is also indicated that DNB has made it more difficult to enter the market, possibly as a result of experiences around IceSave and DSB. In a response to parliamentary questions, the Ministry of Finance (2014) indicated that DNB is primarily responsible for financial stability and not for competition in the mortgage market.
Competition before the crisis
Before the financial crisis, studies show mixed effects. For example, Toolsema and Jacobs (2007) observe a non-competitive market because mortgage interest rates respond more quickly to cost increases than cost decreases based on data between 1978 and 2000.3
3 Using a comparable method, SOMI has also established that the Dutch mortgage market within Europe, together with Italy and Portugal, has the least competitive mortgage market. This is remarkable given that the competition authorities have found anti-competitive effects.
At the same time, De Haan and Sterken (2006; 2011), based on data between 1998 and 2003, show that there is a price leader in the Dutch mortgage market, even if they set their prices in the same way.
Boot (2007) and Schinkel (2007) note that the Dutch banking sector is highly concentrated, but that there is fierce competition. Hassink and Leuvenstein (2003) use data between 1996 and 2001 and indicate that Dutch banks may enjoy market power because prices differ between different providers.
At the same time, this spread indicates that it is unlikely that different providers conspire. Treur and Boonstra (2014) also indicate that competition in the period 2004-2008 was so strong that providers made average losses, fueled by price fighters in the market such as Sparq.
Conclusion
Rising costs do not fully explain higher Dutch mortgage interest rates, there is probably more going on in the area of competition. Almost every study on the Dutch mortgage market gives competition as an explanation for the high mortgage interest rates, although the explanations for this differ.
Ultimately, the different competition statements are mainly complementary: Precisely markets that are attractive to new entrants, but the barriers that keep entrants out are also strong. Also, price leadership bans have the strongest effects in concentrated markets.4
4 Note that Commerzbank in Germany, for example, was also subject to a price leadership ban with little effect, due to the diffuse nature of the German mortgage market.
As a result of this leap, price leadership bans are the most likely explanation for the high Dutch mortgage interest rates.
- 4. Conclusion
After the spring of 2009, Dutch mortgage rates were significantly higher than mortgage rates in neighboring countries, while closely following the European average before this.
This remarkable phenomenon has led to a large number of studies into the Dutch mortgage market, the majority of which indicate that high interest rates are partly due to reduced competition. While surveys based on data before the financial crisis indicate that the Dutch market is highly concentrated but overall competitive.
The explanations of how competition has diminished vary; the European Commission's imposition of price leadership bans is consistent with the abrupt shift in the Dutch mortgage market and several studies provide price leadership bans as a direct explanation.
- 5. References
ACMÃÂÃÂ (2013),ÃÂÃÂ Concurrentie op de hypotheekmarkt: Een update van de margeontwikkelingen sinds begin 2011, Den Haag: Autoriteit Consument en Markt.
ACMÃÂà(2014),ÃÂàBarriÃÂères voor toetreding tot de Nederlandse bancaire retailsector, Den Haag: Autoriteit Consument en Markt.
Admati, A.R., P.M. DeMarzo, M.F. Hellwig en P.C. PfleidererÃÂÃÂ (2013), Fallacies, irrelevant facts, and myths in the discussion of capital regulation: why bank equity is not expensive.ÃÂÃÂ Rock Center for Corporate Governance at Stanford University Working Paper No. 86.
Boonstra, W., en L. TreurÃÂÃÂ (2012), Reactie op: Hollands hoge hypotheekrentes,ÃÂÃÂ Economisch Statistische Berichten, Vol. 97(4645), p. 598-599.
Boot, A.W.A.ÃÂÃÂ (2007) Competitiveness assessment and key issues for the Dutch retail banking sector. Onderzoeksrapport uitgebracht in opdracht van de OECD, 1 juli, zie www.acle.nl.
Boot, A.W.A., en M.P. SchinkelÃÂÃÂ (2007), Concurrentie op de Nederlandse bancaire markt,ÃÂÃÂ Economisch Statistische Berichten, 7 september, p. 520-522.
Centraal PlanbureauÃÂÃÂ (2013), The Dutch housing market - mortgage interest rates, house prices and consumption,ÃÂÃÂ CPB Communication, February 14.
Commissie Wijffels (2013),ÃÂÃÂ Naar een dienstbaar en stabiel bankwezen. Den Haag: Commissie Structuur Nederlandse Banken.
Degryse, H., en S. OngenaÃÂÃÂ (2013),ÃÂÃÂ Expert Opinion on the Intensity of Competition in the Dutch Banking Sector, Den Haag: Commissie Structuur Nederlandse Banken.
Dijkstra, M.A.ÃÂÃÂ (2017),ÃÂÃÂ Economies of scale and scope in banking: Effects of government intervention, corporate strategy and market power, Amsterdam: Amsterdam University Press
Dijkstra, M.A., en M.P. SchinkelÃÂà(2012), NMaâÃÂÃÂs Mortgage-Rate-Calculation-Method: Actualization and Reinterpretation,ÃÂàAmsterdam Law School Research Paper No. 2012-84 and Amsterdam Center for Law & Economics Working Paper No. 2012- 07.
Dijkstra, M.A., en M.P. SchinkelÃÂÃÂ (2012), Hollands hoge hypotheekrentes,ÃÂÃÂ Economisch Statistische Berichten, Vol. 97(4645), p. 594-597.
Dijkstra, M.A., en M.P. SchinkelÃÂà(2013), Extra-Margins in ACM's Adjusted NMa âÃÂÃÂMortgage-Rate-Calculation Method,ÃÂàAmsterdam Law School Research Paper No. 2013-40 and Amsterdam Center for Law & Economics Working Paper No. 2013- 10.
Dijkstra, M.A., F. Randag, en M.P. SchinkelÃÂà(2014), High mortgage rates in the Low Countries: what happened in the spring of 2009?ÃÂàJournal of Competition Law and Economics, Vol. 10(4), p. 843 âÃÂà859.
DNBÃÂÃÂ (2015), Visie op de structuur van de Nederlandse bankensector,ÃÂÃÂ Amsterdam: De Nederlandsche Bank.
Francke, M., A. van de Minne, en J. VerbruggenÃÂÃÂ (2014), The effect of credit conditions on the Dutch housing market,ÃÂÃÂ DNB Working Paper No. 447.
Haan, L., de, en E. SterkenÃÂÃÂ (2006), Price Leadership in the Dutch Mortgage Market, DNB Working Toolsema, L.A., and J.P.A.M. Jacobs (2007), Why do Prices Rise Faster Than They Fall? With an Application to Mortgage Rates,ÃÂÃÂ Managerial and Decision Economics, Vol. 28, p. 701-712.
Haan, L. de, en E. SterkenÃÂÃÂ (2011), Bank-Specific Daily Interest Rate Adjustment in the Dutch Mortgage Market,ÃÂÃÂ Journal of Financial Services Research, Vol. 39(3), p. 145-159.
Hassink, W., en M. van LeuvensteinÃÂÃÂ (2003), Price setting and price dispersion in the Dutch mortgage market,ÃÂÃÂ CPB Discussion Paper No. 21.
Jansen, J., M. Bijlsma, M. Kruidhof, en C. PattipeilohyÃÂÃÂ (2013), Funding problems in the mortgage market,ÃÂÃÂ DNB Occasional Studies, Volume 11-1.
KPMGÃÂÃÂ (2014),ÃÂÃÂ Barriers to entry, growth and exit in the retail banking market in the Netherlands, Amsterdam: KPMG.
Mastrogiacomo, M., en R. van der MolenÃÂÃÂ (2015), Dutch mortgages in the DNB loan level data,ÃÂÃÂ DNB Occasional Studies Vol. 13-4.
Ministerie van FinanciÃÂënÃÂà(2014), Kabinetsreactie ACM rapport toetredingsbarriÃÂères, 5 september.
Minne, A. van de, en F. TeppaÃÂÃÂ (2015), Demand and supply of mortgage credit,ÃÂÃÂ DNB Working Paper No. 486.
Modigliani, F., en M.H. MillerÃÂÃÂ (1958), The Cost of Capital, Corporation Finance and the Theory of Investment,ÃÂÃÂ American Economic Review, Vol. 48(3), p. 261-297.
Mulder, M. (2014), The Impact Of Concentration and Regulation on Competition in the Dutch Mortgage Market,ÃÂÃÂ Journal of Competition Law & Economics, Vol. 10(4), p. 795-817.
Mulder, M. en M. LengtonÃÂÃÂ (2011), Invloed concurrentie op hypotheekrente,ÃÂÃÂ Economisch Statistische Berichten, Vol. 96(4618), p. 558-561.
NMaÃÂÃÂ (2010),ÃÂÃÂ Quick Scan Hypotheekrente: Een onderzoek naar de marges op hypotheken, Den Haag: Nederlandse Mededingingsautoriteit.
NMaÃÂÃÂ (2011),ÃÂÃÂ Sectorstudie Hypotheekmarkt: Een onderzoek naar de concurrentieomstandigheden op de Nederlandse hypotheekmarkt, Den Haag: Nederlandse Mededingingsautoriteit.
Overvest, B.M., en G. TezelÃÂÃÂ (2014), Notes on the Margin: An Overview of NMa's Mortgage Market Study,ÃÂÃÂ Journal of Competition Law & Economics, Vol. 10(4), p. 779-794.
Spierdijk, L.ÃÂà(2012) De invloed van bankenconcurrentie op de economie. ESB, 97(4643), 545âÃÂÃÂ547
Treur, L., en W. BoonstraÃÂÃÂ (2014), Competition in the Dutch Mortgage Market: Notes on Concentration, Entry, Funding, and Margins,ÃÂÃÂ Journal of Competition Law & Economics, Vol. 10(4), p. 819-841.